Recency bias is a cognitive bias that favors recent events over historic ones. Recency bias is the tendency to think that trends and patterns (called “momentum” in financial markets) we have observed in the recent past will continue in the future.
Sadly, predicting the future events on the base of the recently occurred events (recent trends and patterns) has been shown to be no more accurate than flipping a coin.
The Recency Fallacy is a great trouble to us, being a particularly tricky sort of behavioural bias that’s rather difficult to overcome.
It works thus: you overfocus on the most recent events you’ve experienced and neglect to worry about older information. We don’t so much integrate new informations with the old information, as we use to overwrite our memories.
Recency bias can skew investors into an inaccurate evaluation of the economic cycles, causing them to continue to invest in a bull market (because they are optimistic from the the recent successful patterns, even when they should grow cautious of its potential continuation) and refrain from buying assets in a bear market (because they remain pessimistic about its prospects of recovery, even when they should grow greedy of its convenient asset prices).
Recency bias would increase panic and make investors believe that things will continue to go wrong, because right now they are going badly, forgetting the old informations that in most cases the world stock market is more positive than negative, despite it has witnessed very strong shocks, including world wars, epidemics, inflation, political crisis, etc.
In order to minimize the impact of recency bias on your decision making, you should learn to
- filter out the noise produced by the most recent informations
- focus on the big picture, looking at the history
- remember the “regressione to the mean”…..”everything that will goes up, sooner or later will goes down”
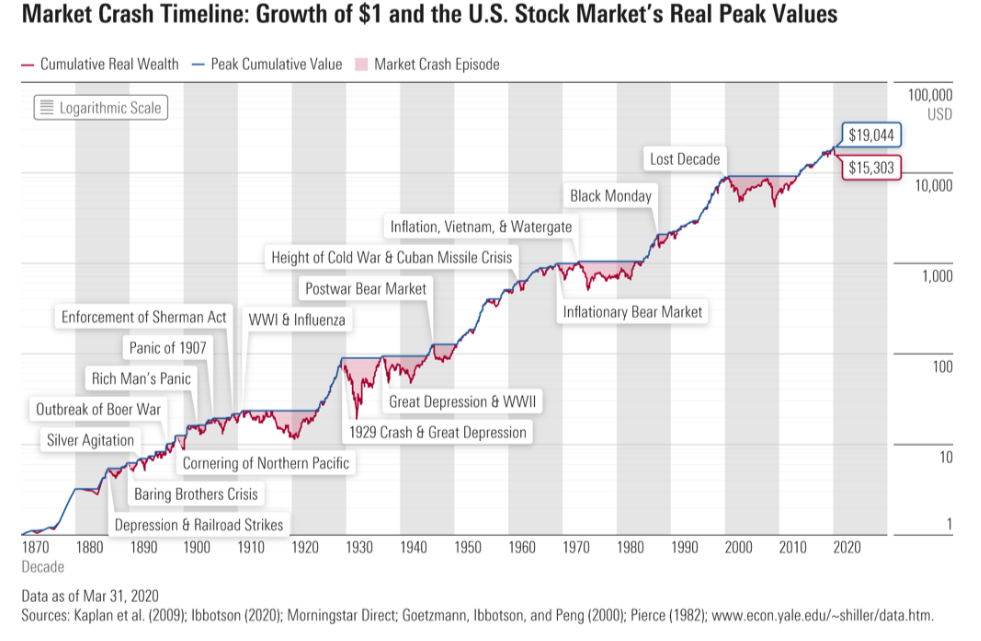
During a market crash, it can be difficult to remember that the market declines are fairly regular occurrences, if you do not observe the full historical picture and remember of the powerful regression to the mean.
Below you can see a nearly 150 years picture of stock market performance. You can clearly see that crashes would happen, in average, about every nine years.