
The chart below shows the calibration curves for two groups of experts:
- Weathermen Group
- Doctors Group
Each group is given information relative to their own discipline, so weather men are given weather patterns and asked to predict the weather, doctors are given case notes and asked to diagnose the patient.
Then, the forecast-diagnosis has been confronted and plotted against the actual outcome (the actual weather and the actual diagnosis).
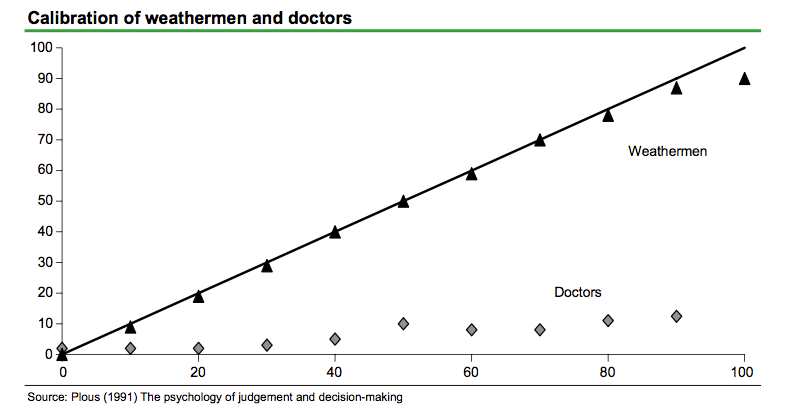
A 45° line would indicate a perfect statistical calibration.
The Weather forecasters actually did remarkably well, almost following in the plot the 45 degree line.
In contrast, doctors are a terrifying bunch of people. When they were 90% sure they were correct, they were actually right less than 15% of the time!
So why the difference in the performance between these two groups?
It largely appears to relate to the illusion of knowledge (defined as a situation where we think we know more than everyone else). Weather men get rapid undeniable evidence on their abilities as forecasters, after all you have to do is look out of the widow to see if they managed to get it right or not. Doctors, in contrast, often lack feedback so find it far harder to know when they have been right or wrong.
